What you have: all your monitoring data and analytics stored over there in Prometheus.
What you’d like to have: all of that data over here in your Postgres database.
Having it all in Postgres would be simpler, easier to keep an eye on, and easier to do something with. But up until now, you couldn’t. At Tembo, we ran into this exact same problem ourselves—we wanted to be able to bring our own monitoring data back into our systems to allow for advanced time-series data queries and management.
So we built the thing that we needed—a one-of-a-kind integration of Prometheus monitoring data into Postgres. This integration is not just about simplifying data workflows; it’s about offering a smarter, more efficient way to manage data.
Want to see how it works? Darren shows us the ropes:
What sets this integration apart? It’s the only current, fully supported solution of its kind. It enables querying for Prometheus metrics directly within Postgres, bridging the gap between Prometheus monitoring and Postgres’s robust database capabilities.
Getting Started
Let us show you how to get up and running:
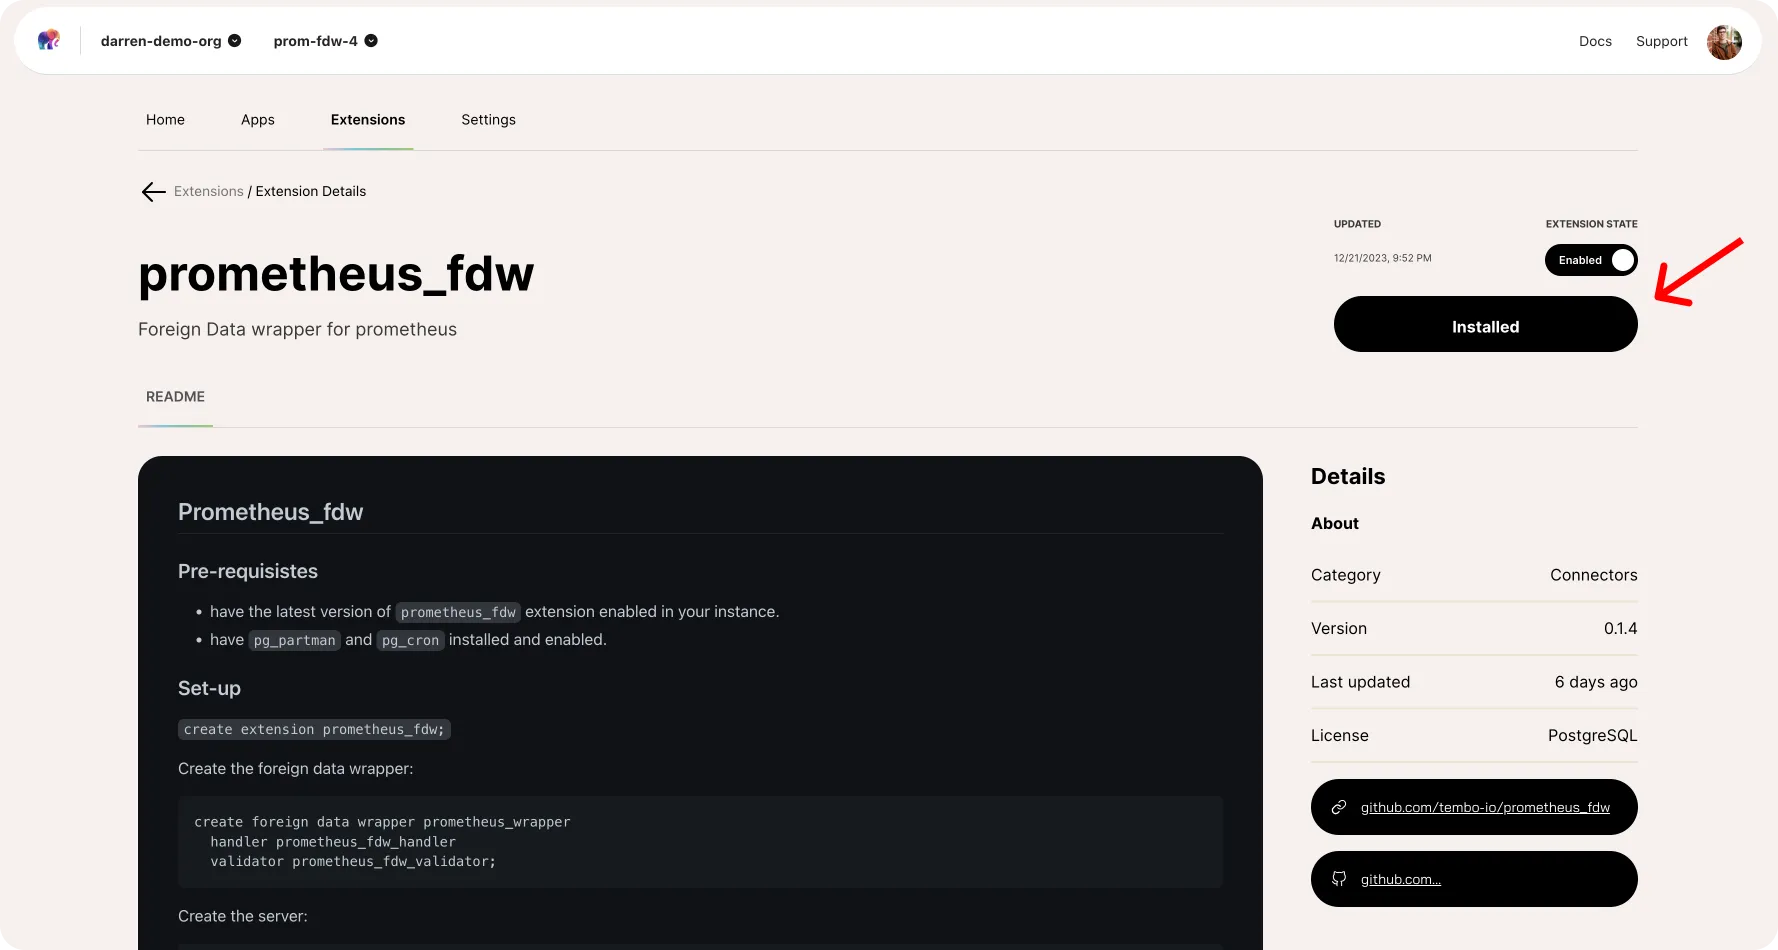
We’ll start by going to the Tembo Cloud UI, clicking the extensions tab, and installing the prometheus_fdw extension in our instance.

Once that’s installed, we can enable the extension, and we’re ready to go. If you’re new to working with foreign data wrappers, it’s important to know that once the extension is enabled, you’ll then need to actually create the foreign data wrapper within your database, like this:
CREATE FOREIGN DATA WRAPPER prometheus_wrapper
HANDLER prometheus_fdw_handler
VALIDATOR prometheus_fdw_validator;
Then we’ll specify the server that we will actually pull the metrics from—you’ll want to insert your Prometheus URL here:
CREATE SERVER my_prometheus_server
FOREIGN DATA WRAPPER prometheus_wrapper
OPTIONS (
    base_url 'https://prometheus-data-1.use1.dev.plat.cdb-svc.com/'
);
And finally, we’ll create a foreign table that specifies exactly what we’ll want to pull from Prometheus:
CREATE FOREIGN TABLE metrics (
    metric_name TEXT,
    metric_labels JSONB,
    metric_time BIGINT,
    metric_value FLOAT8
)
SERVER my_prometheus_server
OPTIONS (
object 'metrics',
step '30s'
);
Querying for data
Now that all that legwork is done, we’re ready to start querying for our data. We just run query our new metrics table, and it returns the values that we’ve specified—keep in mind that depending on the size of your Prometheus database, this may be a fairly large batch of data:
SELECT
  *
FROM metrics
WHERE
  metric_name='your_metric_name'
  AND metric_time > start_time AND metric_time < end_time;
But now that this is running, we have our Prometheus data integrated seamlessly into our Postgres instance, and we can start putting it to work. For us, we’ve done things like pairing it with pg_cron and pg_partman to automatically sync + update our reporting in postgres, enabling our GTM team to have easy access to insights about who is using our platform (and how!)
To dig deeper, take a look at the prometheus_fdw repo, and give it a star while you’re there. Then give it a try for yourself at Tembo Cloud!
